For T-SQL Tuesday, Brent Ozar asked us to write about the most recent ticket we closed. I’m going to write a bit about the most recent project I wrapped up. Although this is a project and not a ticket, the story is recent and it really gives an idea of “what exactly it is that I do” so I figure it’s a fair story.
I just finished up a project to consolidate servers by using Resource Governor.
The problem
How do we predict whether it’s safe to put workloads from two servers onto one?
We use Availability Groups to create readable secondary replicas (which I’ll call mirrors). The mirrors are used to offload reporting workloads. The mirrors are mostly bound by IOPS and the primaries are mostly bound by CPU, so I wondered “Is there any wiggle room that lets us consolidate these servers?”
Can we point the reporting workloads (queries) at the primary replica safely? To do that we’d have to use something like Resource Governor to throttle IO (MAX_IOPS_PER_VOLUME) because we don’t want to overwhelm the primary.
Some questions I want to answer:
- What value should I use for
MAX_IOPS_PER_VOLUME? - Is there a safe value at all?
- If I consider any given threshold value X, how much longer will it take to generate reports?
- Since we have dozens of mirrors, which servers can we decommission?
Think about that for a second. How would you answer these questions? What data would you want to collect to help you answer these questions?
First visualize the workload
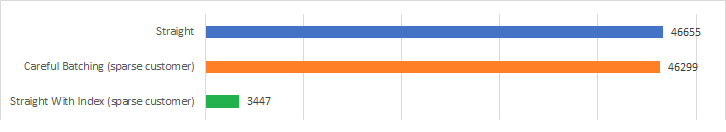
We visualized the existing reporting workload (read operations) for the mirrors. For some of them, the answers were obvious. For example, look at the following graph.
The light traffic server (blue line) would never be notice if we applied a maximum threshold of 2000 IOPS. So that mirror is safe to throttle and point to the primary. Meanwhile the traffic from the heavy traffic server (orange line) could never do the same amount of work if we throttled it.

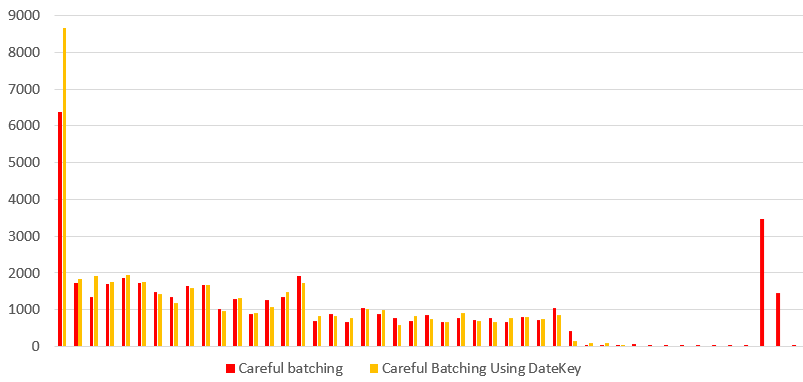
But what about a server with a workload like the following? It’s not as clear.

Next, model a throttled workload
On the assumption that the reads still needed to happen even when throttled, we wanted to know, how long of a stretch would the reads be saturated for. i.e. If we throttle at 2000 IOPS, would we see the IO be saturated for longer than say 10 minutes?
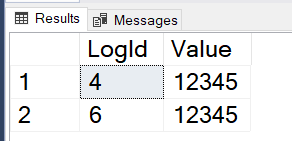
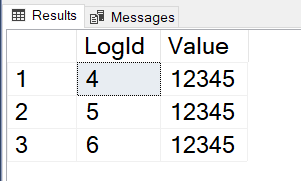
Using Excel, I added three new calculated columns, work_to_be_done, throttled_work_done, and work_left_to_do. If there was any work left to do, it fed into the work to be done of the next row like this:
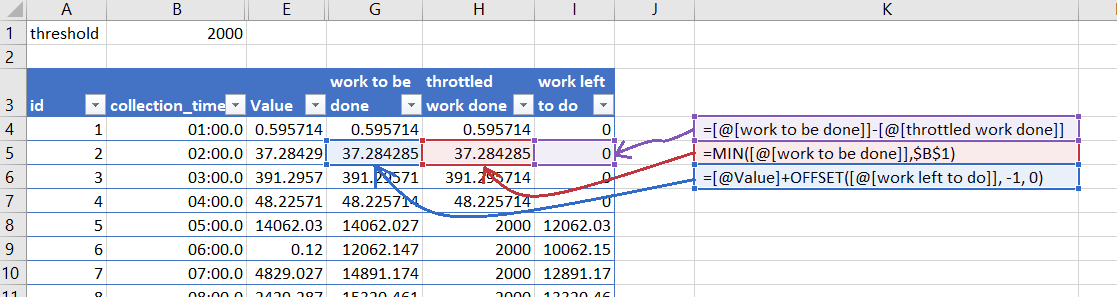
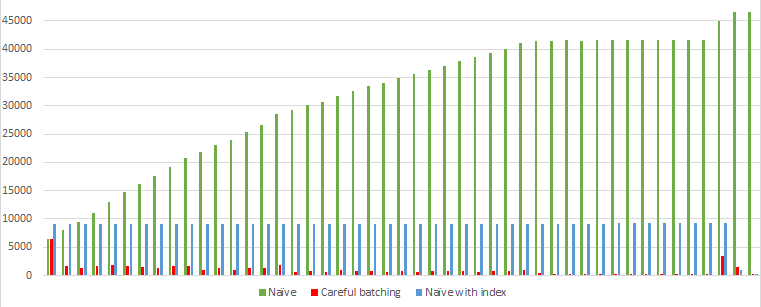
So now I can visualize what the “throttled” work would look like
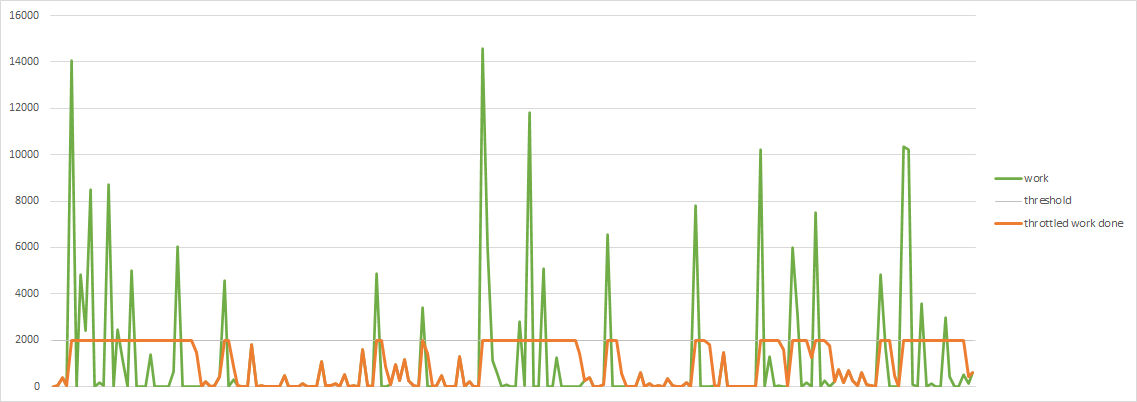
After that, it wasn’t to hard to calculate the longest stretch of saturated IO as kind of proxy for the maximum duration of report generation.
This model isn’t perfect. It’s inaccurate because we made a ton of assumptions, but it was useful. It helped us identify reports on mirrors that could be run on the primary replica.
In our case we were happily surprised. After we applied the RG settings to the various servers we deemed safe, the resulting behavior was accurate to the model and it let us consolidate the servers the way we wanted.
So that was fun.
This size of and type of project pops up all the time for me. Not daily of course, the start-to-finish duration of this project is measured in months. Next up I’m in the middle of trying to figure out how to maximize ONLINE-ness while using Standard Edition. Wish me luck.